Sign up for restaurant insights
Understanding your customer base is essential to creating a profitable restaurant. Learn more about who orders from your restaurant by exploring the new customer insights dashboard available through your Grubhub for Restaurants account. This dashboard will give you insight into your customer base, providing financial, ordering and comparative data for review.
Not a Grubhub for Restaurants partner? Click here to sign up!

What is the customer insights dashboard?
“Customer Insights” is a tool available to all Grubhub partners that provides insight on who makes up their customer base on Marketplace. On this dashboard, restaurants can see their financial, ordering and comparative data for review.
The customer insights dashboard gives comparative data to restaurants based on two categories: new vs returning customers and Grubhub+ vs non Grubhub+ customers.
Both dashboards present data on the following information:
- Total sales: The gross sum of all prepaid orders before any deductions are made
- Total orders: The number of prepaid orders received within the selected timeframe
- Average daily orders: The total orders divided by the number of days in the selected timeframe
- Average order value: The total sales divided by the total orders
New vs returning customers
This tab on the customer insights dashboard allows users to compare the data between new and returning customers. This dashboard shows the total sales, average order value, total orders and average daily orders for both new and existing customers.
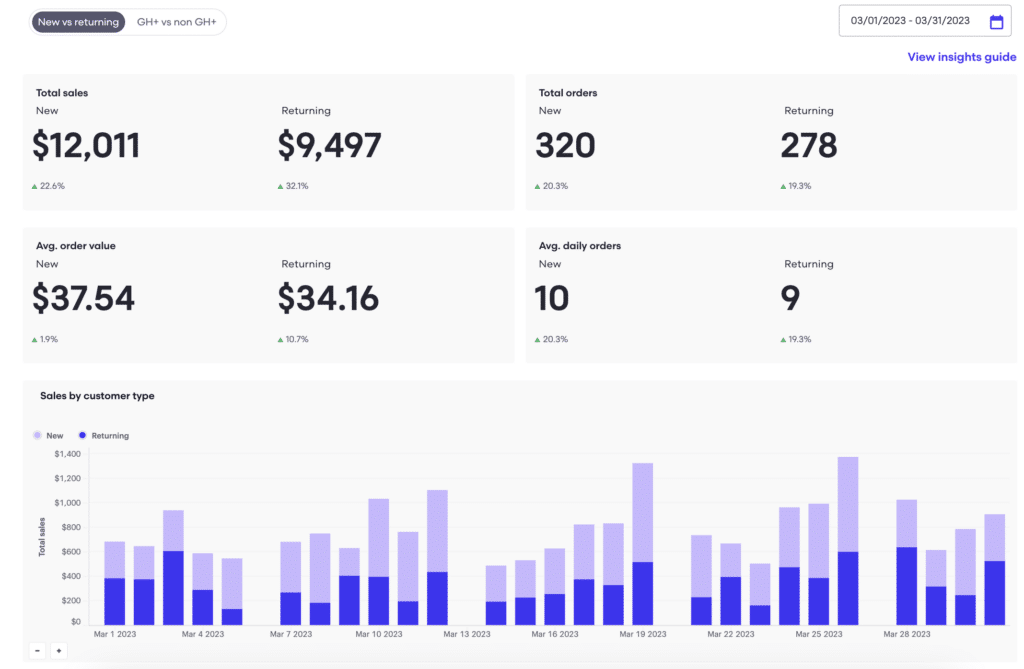
In this dashboard tab, restaurateurs can view their sales and order data for new customers compared to existing customers. Knowing this information can help guide who restaurants should target in their marketing strategy.
Grubhub+ vs non-Grubhub+ customers
This tab on the Customer Insights dashboard allows users to compare the data between GH+ and non-GH+ customers. GH+ customers pay a membership fee for $0 delivery, and often are the most active and loyal customers. This dashboard shows the total sales, average order value, total orders and average daily orders for both GH+ and non-GH+ customers.
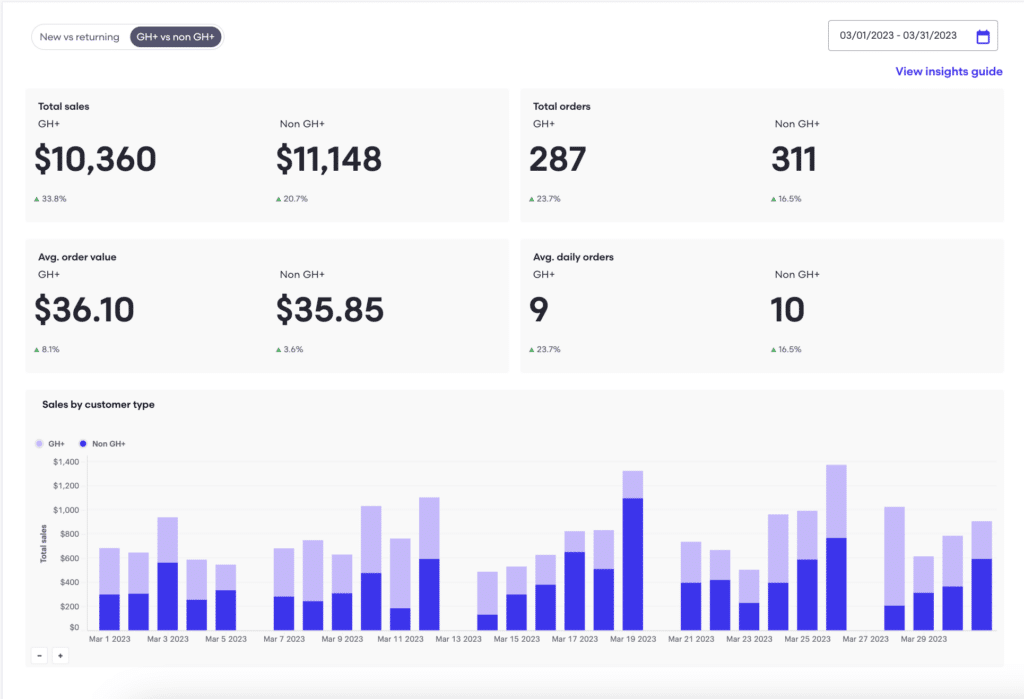
Getting insights into Grubhub+ customers can help you tailor promotions that will encourage these high-frequency customers to place orders.
How can restaurants access Customer Insights?
All restaurant partners can now access Customer Insights through their Grubhub for Restaurants account. To view these insights, follow these simple steps:
Step 1: Log into Grubhub for Restaurants
Step 2: Navigate to the menu bar and click on the Insights tab > Customer Insights
Step 3: You can now view your Customer Insights and toggle between the two different dashboard tabs.
Step 4: You can select a time frame to view data by navigating to the calendar icon on the top right corner of the dashboard and selecting your preferred dates.
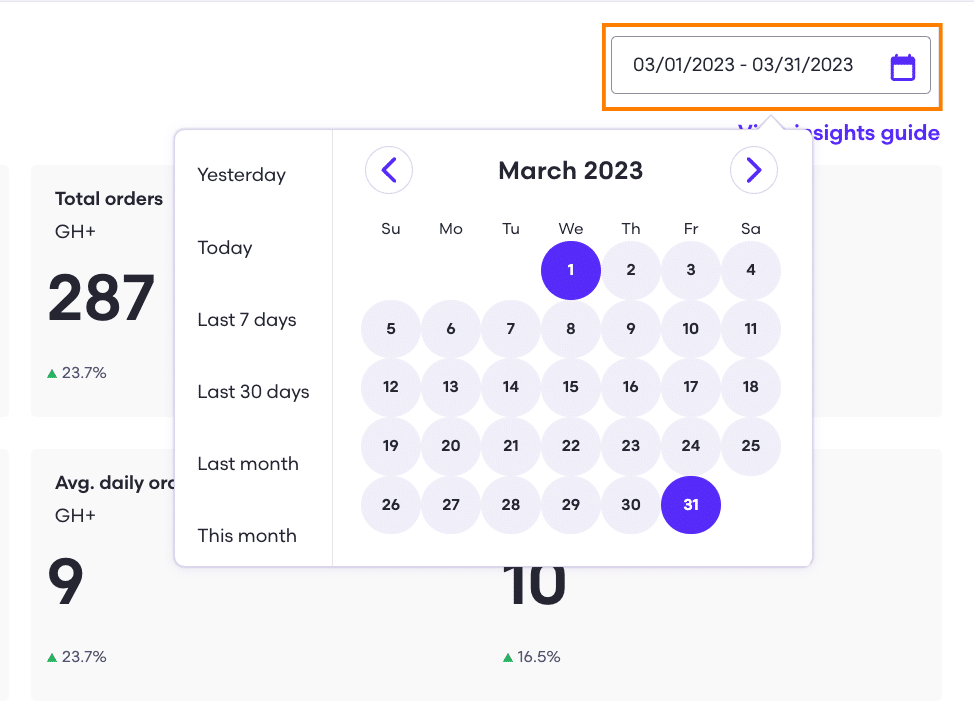
When selecting a time frame, the percentage below each datapoint will update to compare the selected time period to the time period prior. Sales statistics are charted and can be modified by timeframe (days, weeks, months) up to a year in total by clicking the – or + symbols beneath the graph.
If you need a refresher on what the data points in this dashboard signify, click on the “view insights guide” link underneath the calendar adjustor to get more information on what the data is showing.
Now that you have access to these customer insights, it’s time to use this data to increase sales. Take a look at how to leverage customer data and create loyalty programs that will encourage customers to keep placing orders.